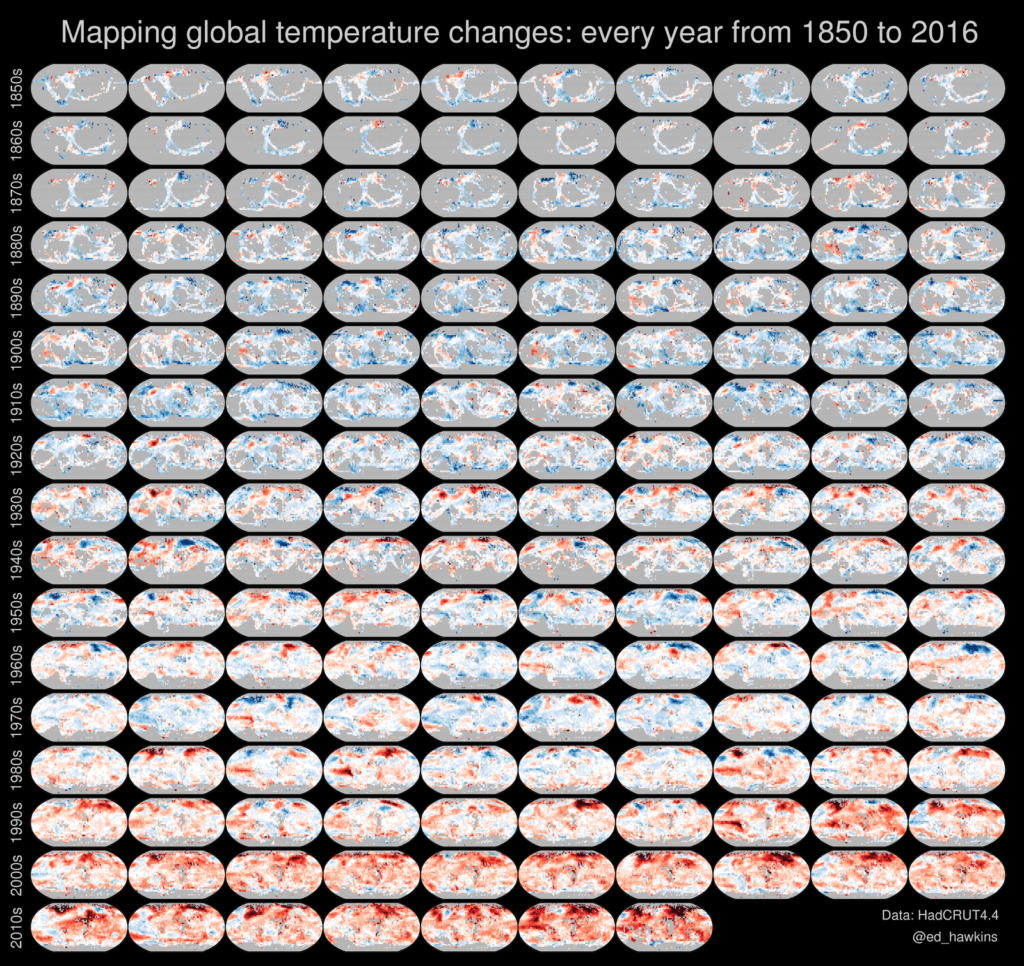
Source: Ed Hawkins. Watch out – the full map is 10MB!University of Reading, England scientist Ed Hawkins built this graphic of snapshots of the globe’s heat temperatures from the 1950s through today with a dataset from the UK’s Met Office, which concerns itself with meteorology. It shows global warming trends quite clearly.